Back to projects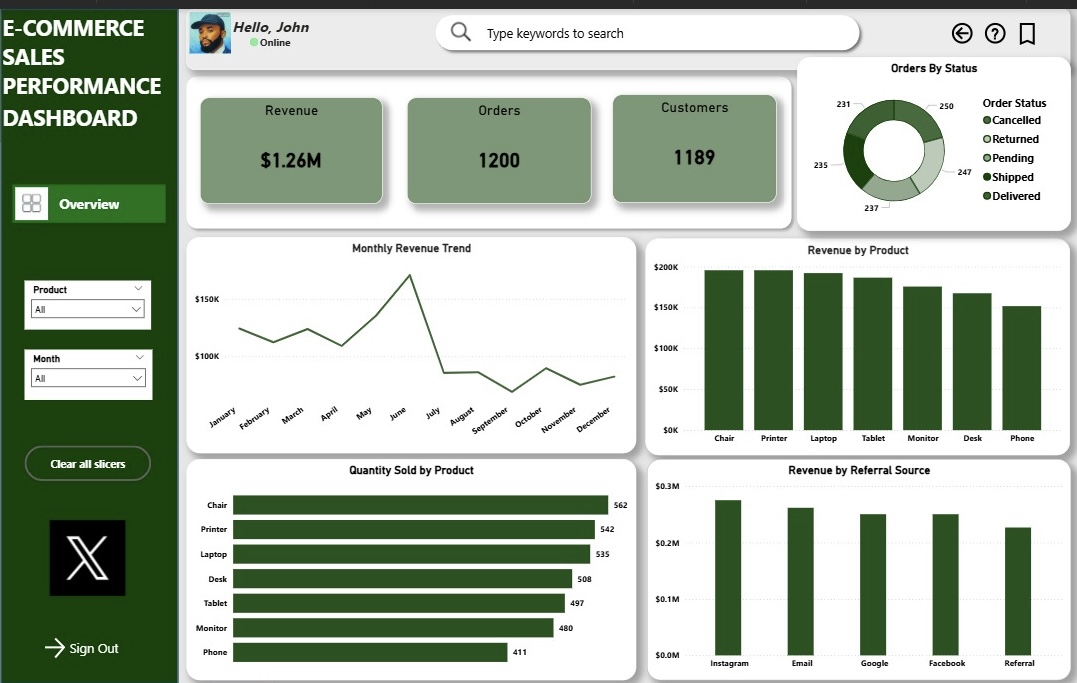
Project Link
GitHubAbout this project
The E-commerce Sales Performance Dashboard was created to analyse e-commerce sales performance and uncover patterns across revenue, orders, customers, products, and referral sources. The dashboard brings these metrics together to provide a clear view of sales performance and highlight areas that require attention.
Business Questions
- • How is overall sales performance changing over time?
- • Which products generate the most revenue?
- • Which products have the highest sales volume?
- • Which referral sources contribute the most revenue?
- • How are orders distributed across different statuses?
Key Insights
- • Revenue peaked around June before declining from July onward.
- • Chair and Printer were the highest revenue products shown in the dashboard.
- • Instagram was the highest revenue referral source shown.
- • Revenue performance varied across the months analysed, highlighting changes in sales performance over time.
- • Comparing revenue and quantity sold provided a clearer view of product performance.
Recommendations
- • Prioritize high performing products such as Chair and Printer while reviewing lower performing products for improvement opportunities.
- • Investigate the factors behind the decline in revenue after June to improve sales consistency.
- • Evaluate Instagram campaigns and identify what makes the channel effective for generating revenue.
- • Review product pricing and sales volume to understand differences in product contribution.
- • Continue monitoring key performance indicators regularly to identify changes and respond quickly.
Tools Used
Power BIData CleaningPower QueryDAXExcel