Back to projects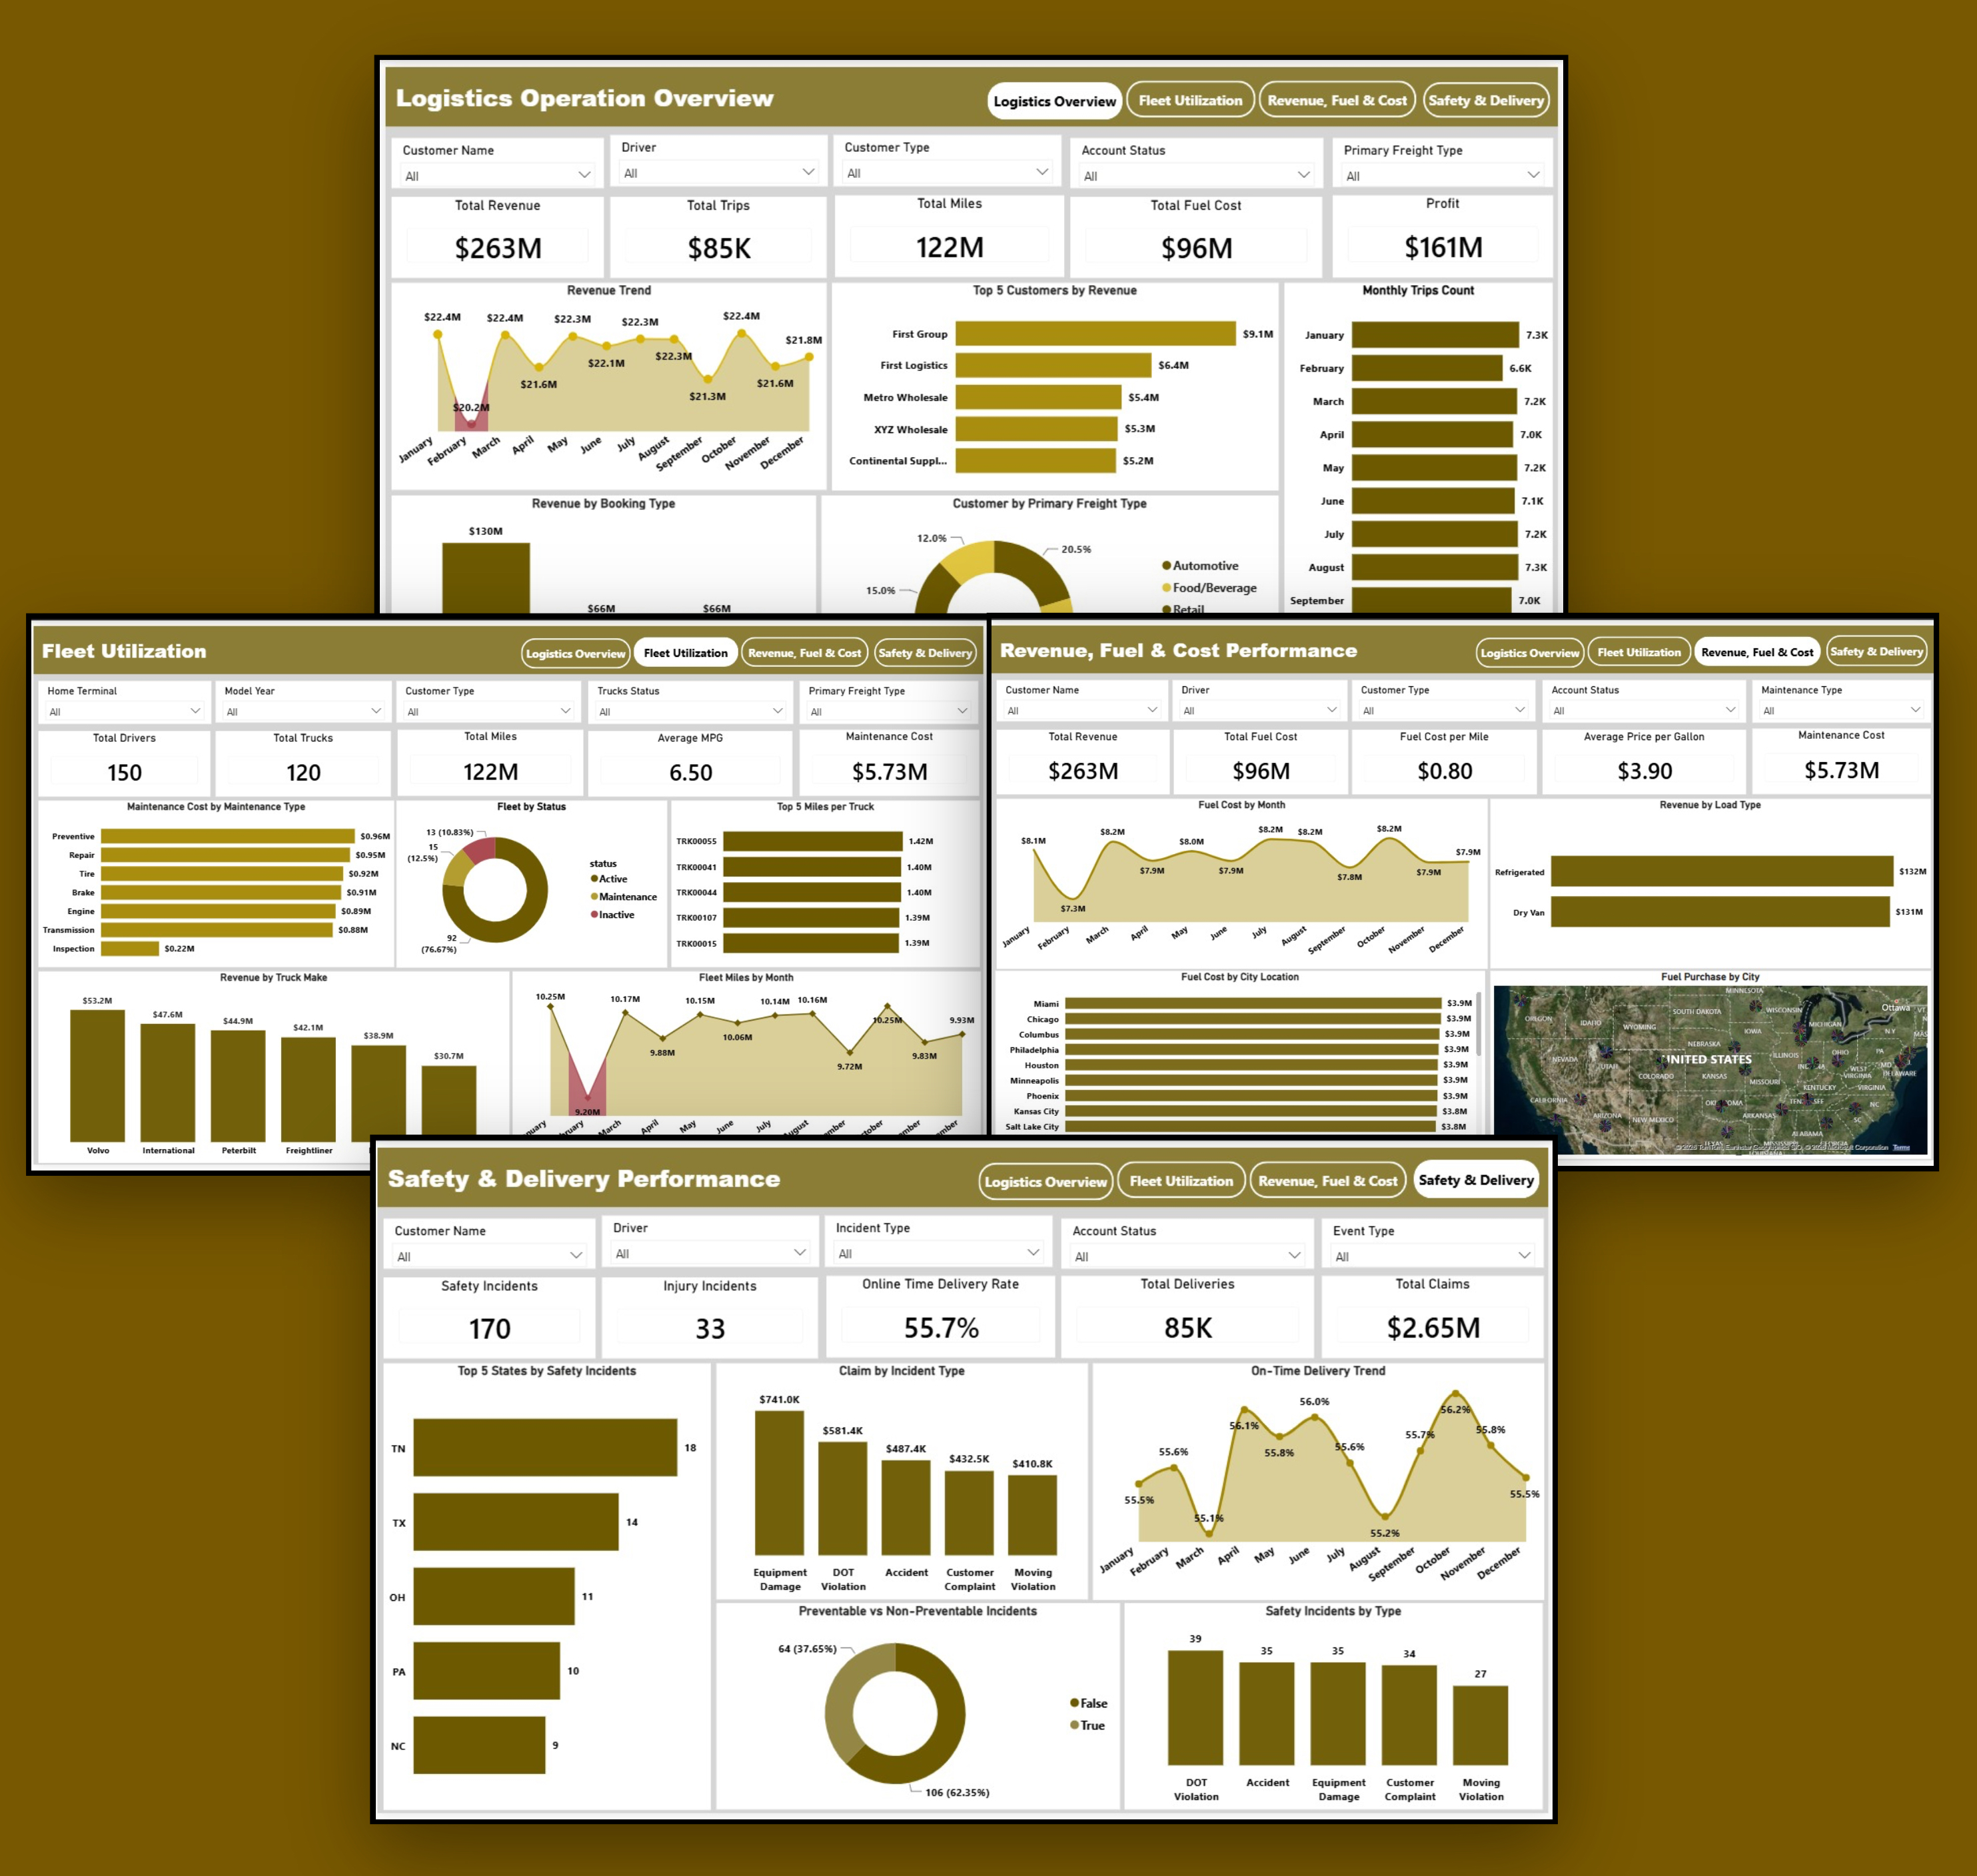
Project Link
GitHubAbout this project
The Logistics Operations Performance Dashboard was created to provide a comprehensive view of logistics and fleet performance. The analysis brings together operational, financial, safety, and delivery data to help identify performance trends, monitor costs, and highlight areas that may require attention.
Business Questions
- • How much revenue is the logistics operation generating?
- • How efficiently is the fleet being utilized?
- • What is the relationship between fuel costs and overall revenue?
- • What is the level of safety performance across the operation?
- • How frequently are safety and injury incidents occurring?
- • How well is the operation performing against its delivery targets?
- • What factors may be contributing to delays and operational inefficiencies?
Key Insights
- • The operation generated $263M in revenue and $161M in profit, indicating strong overall financial performance.
- • Fuel costs reached $96M, making fuel efficiency an important area for operational cost management.
- • The fleet covered 122M miles, reflecting substantial operational activity.
- • A total of 170 safety incidents were recorded, including 33 injury incidents, highlighting the importance of continued safety monitoring.
- • On-time delivery stood at 55.7%, indicating that delivery performance has room for improvement.
- • Revenue, fleet activity, operating costs, safety, and delivery performance are closely connected and should be monitored together when evaluating overall operational efficiency.
Recommendations
- • Monitor fuel consumption and fuel cost per mile to identify inefficient vehicles and opportunities to reduce fuel expenditure.
- • Track vehicle utilization, mileage, and downtime to identify underutilized assets and improve fleet productivity.
- • Analyze safety and injury incidents by vehicle, driver, location, or time period to identify recurring risk patterns.
- • Investigate the factors contributing to delayed deliveries and use the findings to improve route planning and scheduling.
- • Monitor fuel and maintenance costs alongside revenue and profitability to identify cost trends.
- • Establish regular monitoring of key operational KPIs to identify emerging issues early and measure improvement over time.
Tools Used
Power BIPower QueryDAX